SIR models
If you click on !!! (the menu bar at the top) maple will execute all commands.
You can also enter each command as you go along reading this document. You may enter your own commands at any time and place in this document.
| > |
 `(`+`(P[1], `-`(`*`..." align="center" border="0"> `(`+`(P[1], `-`(`*`..." align="center" border="0">
 `(`+`(P[1], `-`(`*`..." align="center" border="0"> `(`+`(P[1], `-`(`*`..." align="center" border="0">
 `(`+`(P[1], `-`(`*`..." align="center" border="0"> `(`+`(P[1], `-`(`*`..." align="center" border="0">
 `(`+`(P[1], `-`(`*`..." align="center" border="0"> `(`+`(P[1], `-`(`*`..." align="center" border="0">
 `(`+`(P[1], `-`(`*`..." align="center" border="0"> `(`+`(P[1], `-`(`*`..." align="center" border="0">
 `(`+`(P[1], `-`(`*`..." align="center" border="0"> `(`+`(P[1], `-`(`*`..." align="center" border="0">
 `(`+`(P[1], `-`(`*`..." align="center" border="0"> `(`+`(P[1], `-`(`*`..." align="center" border="0">
 `(`+`(P[1], `-`(`*`..." align="center" border="0"> `(`+`(P[1], `-`(`*`..." align="center" border="0">
 `(`+`(P[1], `-`(`*`..." align="center" border="0"> `(`+`(P[1], `-`(`*`..." align="center" border="0">
 `(`+`(P[1], `-`(`*`..." align="center" border="0"> `(`+`(P[1], `-`(`*`..." align="center" border="0">
 `(`+`(P[1], `-`(`*`..." align="center" border="0"> `(`+`(P[1], `-`(`*`..." align="center" border="0">
 `(`+`(P[1], `-`(`*`..." align="center" border="0"> `(`+`(P[1], `-`(`*`..." align="center" border="0">
 `(`+`(P[1], `-`(`*`..." align="center" border="0"> `(`+`(P[1], `-`(`*`..." align="center" border="0">
 `(`+`(P[1], `-`(`*`..." align="center" border="0"> `(`+`(P[1], `-`(`*`..." align="center" border="0">
 `(`+`(P[1], `-`(`*`..." align="center" border="0"> `(`+`(P[1], `-`(`*`..." align="center" border="0">
 `(`+`(P[1], `-`(`*`..." align="center" border="0"> `(`+`(P[1], `-`(`*`..." align="center" border="0">
 `(`+`(P[1], `-`(`*`..." align="center" border="0"> `(`+`(P[1], `-`(`*`..." align="center" border="0">
 `(`+`(P[1], `-`(`*`..." align="center" border="0"> `(`+`(P[1], `-`(`*`..." align="center" border="0">
 `(`+`(P[1], `-`(`*`..." align="center" border="0"> `(`+`(P[1], `-`(`*`..." align="center" border="0">
 `(`+`(P[1], `-`(`*`..." align="center" border="0"> `(`+`(P[1], `-`(`*`..." align="center" border="0">
 `(`+`(P[1], `-`(`*`..." align="center" border="0"> `(`+`(P[1], `-`(`*`..." align="center" border="0">
 `(`+`(P[1], `-`(`*`..." align="center" border="0"> `(`+`(P[1], `-`(`*`..." align="center" border="0">
 `(`+`(P[1], `-`(`*`..." align="center" border="0"> `(`+`(P[1], `-`(`*`..." align="center" border="0">
 `(`+`(P[1], `-`(`*`..." align="center" border="0"> `(`+`(P[1], `-`(`*`..." align="center" border="0">
 `(`+`(P[1], `-`(`*`..." align="center" border="0"> `(`+`(P[1], `-`(`*`..." align="center" border="0">
 `(`+`(P[1], `-`(`*`..." align="center" border="0"> `(`+`(P[1], `-`(`*`..." align="center" border="0">
 `(`+`(P[1], `-`(`*`..." align="center" border="0"> `(`+`(P[1], `-`(`*`..." align="center" border="0">
 `(`+`(P[1], `-`(`*`..." align="center" border="0"> `(`+`(P[1], `-`(`*`..." align="center" border="0">
 `(`+`(P[1], `-`(`*`..." align="center" border="0"> `(`+`(P[1], `-`(`*`..." align="center" border="0">
 `(`+`(P[1], `-`(`*`..." align="center" border="0"> `(`+`(P[1], `-`(`*`..." align="center" border="0">
 `(`+`(P[1], `-`(`*`..." align="center" border="0"> `(`+`(P[1], `-`(`*`..." align="center" border="0">
 `(`+`(P[1], `-`(`*`..." align="center" border="0"> `(`+`(P[1], `-`(`*`..." align="center" border="0">
 `(`+`(P[1], `-`(`*`..." align="center" border="0"> `(`+`(P[1], `-`(`*`..." align="center" border="0">
 `(`+`(P[1], `-`(`*`..." align="center" border="0"> `(`+`(P[1], `-`(`*`..." align="center" border="0">
 `(`+`(P[1], `-`(`*`..." align="center" border="0"> `(`+`(P[1], `-`(`*`..." align="center" border="0">
 `(`+`(P[1], `-`(`*`..." align="center" border="0"> `(`+`(P[1], `-`(`*`..." align="center" border="0">
 `(`+`(P[1], `-`(`*`..." align="center" border="0"> `(`+`(P[1], `-`(`*`..." align="center" border="0">
 `(`+`(P[1], `-`(`*`..." align="center" border="0"> `(`+`(P[1], `-`(`*`..." align="center" border="0">
 `(`+`(P[1], `-`(`*`..." align="center" border="0"> `(`+`(P[1], `-`(`*`..." align="center" border="0">
 `(`+`(P[1], `-`(`*`..." align="center" border="0"> `(`+`(P[1], `-`(`*`..." align="center" border="0">
 `(`+`(P[1], `-`(`*`..." align="center" border="0"> `(`+`(P[1], `-`(`*`..." align="center" border="0">
 `(`+`(P[1], `-`(`*`..." align="center" border="0"> `(`+`(P[1], `-`(`*`..." align="center" border="0">
 `(`+`(P[1], `-`(`*`..." align="center" border="0"> `(`+`(P[1], `-`(`*`..." align="center" border="0">
 `(`+`(P[1], `-`(`*`..." align="center" border="0"> `(`+`(P[1], `-`(`*`..." align="center" border="0">
 `(`+`(P[1], `-`(`*`..." align="center" border="0"> `(`+`(P[1], `-`(`*`..." align="center" border="0">
 `(`+`(P[1], `-`(`*`..." align="center" border="0"> `(`+`(P[1], `-`(`*`..." align="center" border="0">
 `(`+`(P[1], `-`(`*`..." align="center" border="0"> `(`+`(P[1], `-`(`*`..." align="center" border="0">
 `(`+`(P[1], `-`(`*`..." align="center" border="0"> `(`+`(P[1], `-`(`*`..." align="center" border="0">
 `(`+`(P[1], `-`(`*`..." align="center" border="0"> `(`+`(P[1], `-`(`*`..." align="center" border="0">
 `(`+`(P[1], `-`(`*`..." align="center" border="0"> `(`+`(P[1], `-`(`*`..." align="center" border="0">
 `(`+`(P[1], `-`(`*`..." align="center" border="0"> `(`+`(P[1], `-`(`*`..." align="center" border="0">
 `(`+`(P[1], `-`(`*`..." align="center" border="0"> `(`+`(P[1], `-`(`*`..." align="center" border="0">
 `(`+`(P[1], `-`(`*`..." align="center" border="0"> `(`+`(P[1], `-`(`*`..." align="center" border="0">
 `(`+`(P[1], `-`(`*`..." align="center" border="0"> `(`+`(P[1], `-`(`*`..." align="center" border="0">
 `(`+`(P[1], `-`(`*`..." align="center" border="0"> `(`+`(P[1], `-`(`*`..." align="center" border="0">
 `(`+`(P[1], `-`(`*`..." align="center" border="0"> `(`+`(P[1], `-`(`*`..." align="center" border="0">
 `(`+`(P[1], `-`(`*`..." align="center" border="0"> `(`+`(P[1], `-`(`*`..." align="center" border="0">
 `(`+`(P[1], `-`(`*`..." align="center" border="0"> `(`+`(P[1], `-`(`*`..." align="center" border="0">
 `(`+`(P[1], `-`(`*`..." align="center" border="0"> `(`+`(P[1], `-`(`*`..." align="center" border="0">
 `(`+`(P[1], `-`(`*`..." align="center" border="0"> `(`+`(P[1], `-`(`*`..." align="center" border="0">
 `(`+`(P[1], `-`(`*`..." align="center" border="0"> `(`+`(P[1], `-`(`*`..." align="center" border="0">
 `(`+`(P[1], `-`(`*`..." align="center" border="0"> `(`+`(P[1], `-`(`*`..." align="center" border="0">
 `(`+`(P[1], `-`(`*`..." align="center" border="0"> `(`+`(P[1], `-`(`*`..." align="center" border="0">
 `(`+`(P[1], `-`(`*`..." align="center" border="0"> `(`+`(P[1], `-`(`*`..." align="center" border="0">
 `(`+`(P[1], `-`(`*`..." align="center" border="0"> `(`+`(P[1], `-`(`*`..." align="center" border="0">
 `(`+`(P[1], `-`(`*`..." align="center" border="0"> `(`+`(P[1], `-`(`*`..." align="center" border="0">
 `(`+`(P[1], `-`(`*`..." align="center" border="0"> `(`+`(P[1], `-`(`*`..." align="center" border="0">
 `(`+`(P[1], `-`(`*`..." align="center" border="0"> `(`+`(P[1], `-`(`*`..." align="center" border="0">
 `(`+`(P[1], `-`(`*`..." align="center" border="0"> `(`+`(P[1], `-`(`*`..." align="center" border="0">
 `(`+`(P[1], `-`(`*`..." align="center" border="0"> `(`+`(P[1], `-`(`*`..." align="center" border="0">
 `(`+`(P[1], `-`(`*`..." align="center" border="0"> `(`+`(P[1], `-`(`*`..." align="center" border="0">
 `(`+`(P[1], `-`(`*`..." align="center" border="0"> `(`+`(P[1], `-`(`*`..." align="center" border="0">
 `(`+`(P[1], `-`(`*`..." align="center" border="0"> `(`+`(P[1], `-`(`*`..." align="center" border="0">
 `(`+`(P[1], `-`(`*`..." align="center" border="0"> `(`+`(P[1], `-`(`*`..." align="center" border="0">
 `(`+`(P[1], `-`(`*`..." align="center" border="0"> `(`+`(P[1], `-`(`*`..." align="center" border="0">
 `(`+`(P[1], `-`(`*`..." align="center" border="0"> `(`+`(P[1], `-`(`*`..." align="center" border="0">
 `(`+`(P[1], `-`(`*`..." align="center" border="0"> `(`+`(P[1], `-`(`*`..." align="center" border="0">
 `(`+`(P[1], `-`(`*`..." align="center" border="0"> `(`+`(P[1], `-`(`*`..." align="center" border="0">
 `(`+`(P[1], `-`(`*`..." align="center" border="0"> `(`+`(P[1], `-`(`*`..." align="center" border="0">
 `(`+`(P[1], `-`(`*`..." align="center" border="0"> `(`+`(P[1], `-`(`*`..." align="center" border="0">
 `(`+`(P[1], `-`(`*`..." align="center" border="0"> `(`+`(P[1], `-`(`*`..." align="center" border="0">
 `(`+`(P[1], `-`(`*`..." align="center" border="0"> `(`+`(P[1], `-`(`*`..." align="center" border="0">
 `(`+`(P[1], `-`(`*`..." align="center" border="0"> `(`+`(P[1], `-`(`*`..." align="center" border="0"> |
We consider SIR models for a population of total size
| > |
 |
 |
(1) |
SIR epidemic
We will go through three examples of epidemic SIR models with diminishing transmission coefficients α=0.01, 0.005, 0.003 and fixed removal rate γ=0.25. The fixed removal rate of 0.25 means that the infected individuals are infected for 4 days.
Example 1: Consider the SIR model with transmission coefficient α=0.01 and removal rate γ=0.25
| > |
 |
![proc (P) options operator, arrow; VectorCalculus:-`<,>`(VectorCalculus:-`+`(P[1], VectorCalculus:-`-`(VectorCalculus:-`*`(VectorCalculus:-`*`(0.1e-1, P[1]), P[2]))), VectorCalculus:-`+`(VectorCalculus...](images/SIR_87.gif)
![proc (P) options operator, arrow; VectorCalculus:-`<,>`(VectorCalculus:-`+`(P[1], VectorCalculus:-`-`(VectorCalculus:-`*`(VectorCalculus:-`*`(0.1e-1, P[1]), P[2]))), VectorCalculus:-`+`(VectorCalculus...](images/SIR_88.gif) |
(2) |
has relative removal rate
| > |
 |
 |
(3) |
and contact number
| > |
)))); 1](images/SIR_91.gif) |
 |
(4) |
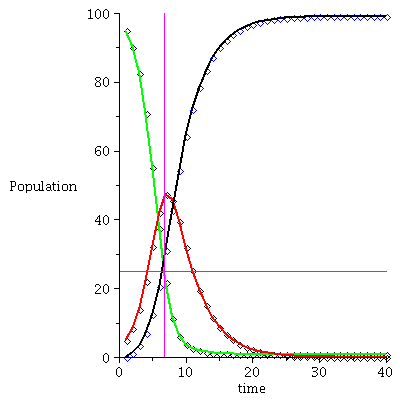
This disease needs at least 25 susceptibles in order to spread. An invidual in this population has 4 potentially contagious contacts over 4 days.
Here is the time plot for the population orbit through P0=<95,5,0>
| > |
![display(timeplot(F, `<,>`(95, 5, 0), 40), implicitplot([y = 25, x = 6.81], x = 0 .. 40, y = 0 .. 100, color = magenta)); 1](images/SIR_93.gif)
![display(timeplot(F, `<,>`(95, 5, 0), 40), implicitplot([y = 25, x = 6.81], x = 0 .. 40, y = 0 .. 100, color = magenta)); 1](images/SIR_94.gif) |
The maximal number of infected occurs when S=ρ after 6-7 time steps.
| > |
![I[max] = max(seq(P[2], P = orbit(F, `<,>`(95, 5, 0), 20))); 1](images/SIR_96.gif) |
![I[max] = 47.31512962](images/SIR_97.gif) |
(5) |
and there remain no
| > |
![S[infinity] = iterate(F, `<,>`(95, 5, 0), 30)[1]; 1](images/SIR_98.gif) |
![S[infinity] = .7920061990](images/SIR_99.gif) |
(6) |
susceptibles in the population after the epidemic.
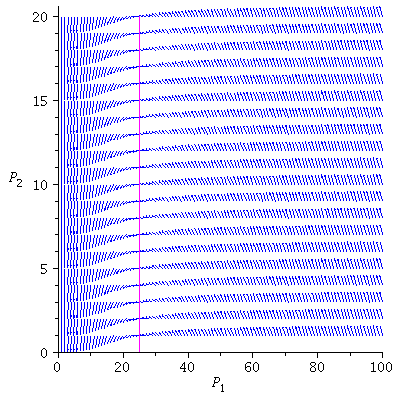
Here is the directional field in the SI-phase plane
| > |
![display([dirfield(F, 100, 20, N), implicitplot(P[1] = rho(F), P[1] = 0 .. 100, P[2] = 0 .. 20, color = magenta)]); 1](images/SIR_100.gif) |
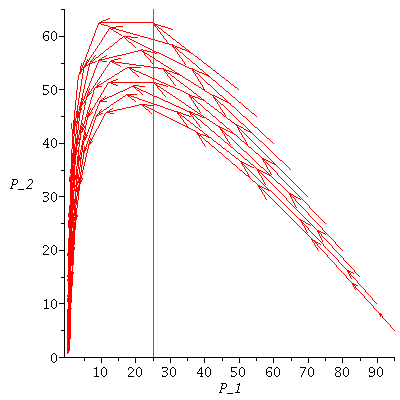
and the orbits through various points
| > |
![display([seq(phasedia(F, P0, 20), P0 = [seq(`<,>`(VectorCalculus:-`+`(100, VectorCalculus:-`-`(VectorCalculus:-`*`(k, 5))), VectorCalculus:-`*`(k, 5), 0), k = 1 .. 10)]), implicitplot(P[1] = rho(F), P...](images/SIR_102.gif)
![display([seq(phasedia(F, P0, 20), P0 = [seq(`<,>`(VectorCalculus:-`+`(100, VectorCalculus:-`-`(VectorCalculus:-`*`(k, 5))), VectorCalculus:-`*`(k, 5), 0), k = 1 .. 10)]), implicitplot(P[1] = rho(F), P...](images/SIR_103.gif) |
The maximal number of infected lies in the range 45-62 and there are no susceptibles left after the epidemic.
| > |
![I[max] = seq(evalf[3](max(seq(P[2], P = orbit(F, P0, 20)))), P0 = [seq(`<,>`(VectorCalculus:-`+`(100, VectorCalculus:-`-`(VectorCalculus:-`*`(5, k))), VectorCalculus:-`*`(5, k), 0), k = 1 .. 10)]); 1](images/SIR_105.gif)
![I[max] = seq(evalf[3](max(seq(P[2], P = orbit(F, P0, 20)))), P0 = [seq(`<,>`(VectorCalculus:-`+`(100, VectorCalculus:-`-`(VectorCalculus:-`*`(5, k))), VectorCalculus:-`*`(5, k), 0), k = 1 .. 10)]); 1](images/SIR_106.gif) |
![I[max] = (47.3, 49.2, 50.7, 51.3, 54.3, 55.3, 57.5, 59.9, 61.7, 62.5)](images/SIR_107.gif) |
(7) |
| > |
![S[infinity] = seq(evalf[3](iterate(F, P0, 30)[1]), P0 = [seq(`<,>`(VectorCalculus:-`+`(100, VectorCalculus:-`-`(VectorCalculus:-`*`(5, k))), VectorCalculus:-`*`(5, k), 0), k = 1 .. 10)]); 1](images/SIR_108.gif) |
![S[infinity] = (.796, .696, .638, .572, .493, .437, .372, .328, .275, .230)](images/SIR_109.gif) |
(8) |
Example 2: The SIR model with transmission coefficient α=0.005 and removal rate ρ=0.25 models an epidemic that is less contagious.
| > |
 |
![proc (P) options operator, arrow; VectorCalculus:-`<,>`(VectorCalculus:-`+`(P[1], VectorCalculus:-`-`(VectorCalculus:-`*`(VectorCalculus:-`*`(0.5e-2, P[1]), P[2]))), VectorCalculus:-`+`(VectorCalculus...](images/SIR_111.gif)
![proc (P) options operator, arrow; VectorCalculus:-`<,>`(VectorCalculus:-`+`(P[1], VectorCalculus:-`-`(VectorCalculus:-`*`(VectorCalculus:-`*`(0.5e-2, P[1]), P[2]))), VectorCalculus:-`+`(VectorCalculus...](images/SIR_112.gif) |
(9) |
has relative removal rate
| > |
 |
 |
(10) |
and contact number
| > |
 |
 |
(11) |
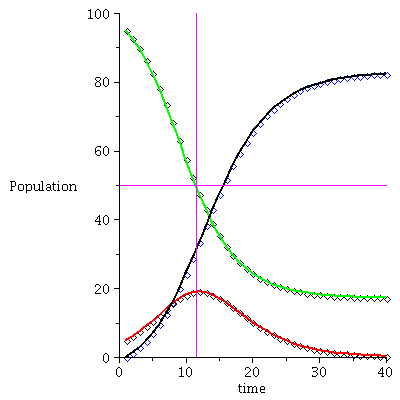
This disease needs at least 50 susceptibles in order to spread. An invidual in this population has 2 potentially contagious contacts over 4 days.
Here is the time plot for the population orbit through <95,5,0>
| > |
![display(timeplot(F, `<,>`(95, 5, 0), 40), implicitplot([y = 50, x = 11.5], x = 0 .. 40, y = 0 .. 100, color = magenta)); 1](images/SIR_117.gif)
![display(timeplot(F, `<,>`(95, 5, 0), 40), implicitplot([y = 50, x = 11.5], x = 0 .. 40, y = 0 .. 100, color = magenta)); 1](images/SIR_118.gif) |
The maximal number of infected occurs when S=ϱ
| > |
![I[max] = max(seq(P[2], P = orbit(F, `<,>`(95, 5, 0), 30))); 1](images/SIR_120.gif) |
![I[max] = 19.07431229](images/SIR_121.gif) |
(12) |
and there remain
| > |
![S[infinity] = iterate(F, `<,>`(95, 5, 0), 30)[1]; 1](images/SIR_122.gif) |
![S[infinity] = 18.02571494](images/SIR_123.gif) |
(13) |
susceptibles in the population after the epidemic.
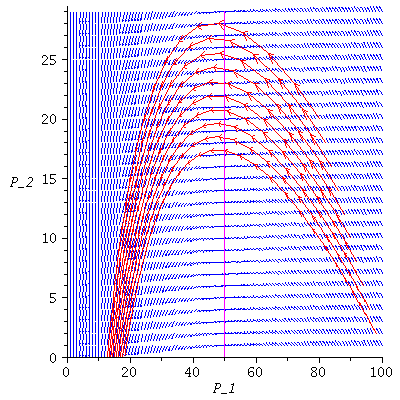
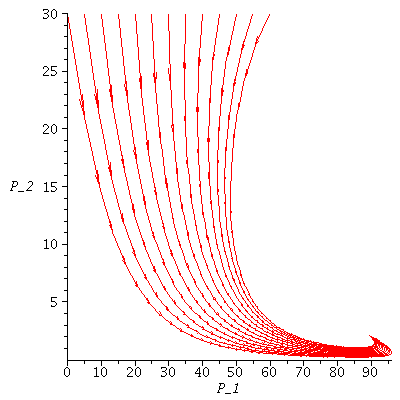
Here are several population orbits in the SI-phase plane
| > |
![display([dirfield(F, 100, 29, 100), seq(phasedia(F, P0, 50), P0 = [seq(`<,>`(VectorCalculus:-`+`(100, VectorCalculus:-`-`(VectorCalculus:-`*`(2, k))), VectorCalculus:-`*`(2, k), 0), k = 1 .. 10)]), im...](images/SIR_124.gif)
![display([dirfield(F, 100, 29, 100), seq(phasedia(F, P0, 50), P0 = [seq(`<,>`(VectorCalculus:-`+`(100, VectorCalculus:-`-`(VectorCalculus:-`*`(2, k))), VectorCalculus:-`*`(2, k), 0), k = 1 .. 10)]), im...](images/SIR_125.gif) |
The maximal number of infected lies in the range 19-50 and there are 6-17 susceptibles left after the epidemic.
| > |
![I[max] = seq(evalf[3](max(seq(P[2], P = orbit(F, P0, 50)))), P0 = [seq(`<,>`(VectorCalculus:-`+`(100, VectorCalculus:-`-`(VectorCalculus:-`*`(5, k))), VectorCalculus:-`*`(5, k), 0), k = 1 .. 10)]); 1](images/SIR_127.gif)
![I[max] = seq(evalf[3](max(seq(P[2], P = orbit(F, P0, 50)))), P0 = [seq(`<,>`(VectorCalculus:-`+`(100, VectorCalculus:-`-`(VectorCalculus:-`*`(5, k))), VectorCalculus:-`*`(5, k), 0), k = 1 .. 10)]); 1](images/SIR_128.gif) |
![I[max] = (19.2, 21.8, 24.7, 28.1, 31.4, 34.6, 38.3, 42.0, 46.2, 50.)](images/SIR_129.gif) |
(14) |
| > |
![S[infinity] = seq(evalf[3](iterate(F, P0, 50)[1]), P0 = [seq(`<,>`(VectorCalculus:-`+`(100, VectorCalculus:-`-`(VectorCalculus:-`*`(5, k))), VectorCalculus:-`*`(5, k), 0), k = 1 .. 10)]); 1](images/SIR_130.gif) |
![S[infinity] = (17.1, 15.8, 14.3, 12.7, 11.6, 10.5, 9.26, 8.25, 7.35, 6.38)](images/SIR_131.gif) |
(15) |
Example 3:The SIR model with transmission coefficient α=0.003 and removal rate γ=0.25
| > |
 |
![proc (P) options operator, arrow; VectorCalculus:-`<,>`(VectorCalculus:-`+`(P[1], VectorCalculus:-`-`(VectorCalculus:-`*`(VectorCalculus:-`*`(0.3e-2, P[1]), P[2]))), VectorCalculus:-`+`(VectorCalculus...](images/SIR_133.gif)
![proc (P) options operator, arrow; VectorCalculus:-`<,>`(VectorCalculus:-`+`(P[1], VectorCalculus:-`-`(VectorCalculus:-`*`(VectorCalculus:-`*`(0.3e-2, P[1]), P[2]))), VectorCalculus:-`+`(VectorCalculus...](images/SIR_134.gif) |
(16) |
has relative removal rate
| > |
 |
 |
(17) |
and contact number
| > |
 |
 |
(18) |
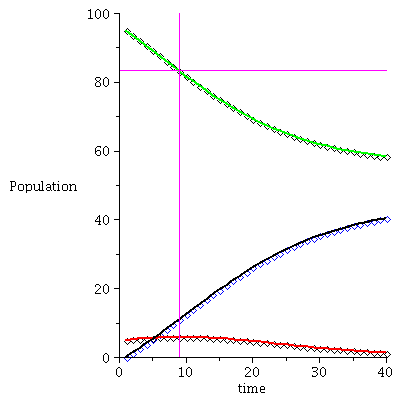
This disease needs at least 83 susceptibles in order to spread. An invidual in this population has 1.2 potentially contagious contacts over 4 days.
Here is the time plot for the population orbit through <95,5,0>
| > |
![display(timeplot(F, `<,>`(95, 5, 0), 40), implicitplot([y = rho(F), x = 9], x = 0 .. 40, y = 0 .. 100, color = magenta)); 1](images/SIR_139.gif)
![display(timeplot(F, `<,>`(95, 5, 0), 40), implicitplot([y = rho(F), x = 9], x = 0 .. 40, y = 0 .. 100, color = magenta)); 1](images/SIR_140.gif) |
The maximal number of infected occurs when S=ϱ
| > |
![I[max] = max(seq(P[2], P = orbit(F, `<,>`(95, 5, 0), 30))); 1](images/SIR_142.gif) |
![I[max] = 5.838911423](images/SIR_143.gif) |
(19) |
and there remain
| > |
![S[infinity] = iterate(F, `<,>`(95, 5, 0), 30)[1]; 1](images/SIR_144.gif) |
![S[infinity] = 61.42707396](images/SIR_145.gif) |
(20) |
susceptibles in the population after the epidemic.
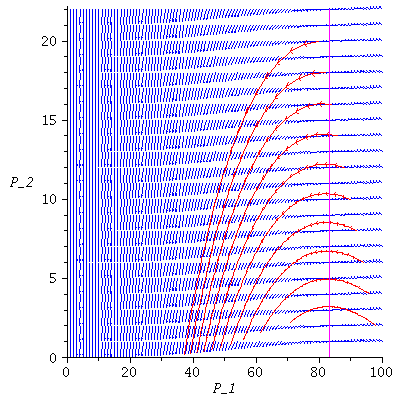
Here are several population orbits in the SI-phase plane
| > |
![display([dirfield(F, 100, 22, 100), seq(phasedia(F, P0, 40), P0 = [seq(`<,>`(VectorCalculus:-`+`(100, VectorCalculus:-`-`(VectorCalculus:-`*`(2, k))), VectorCalculus:-`*`(2, k), 0), k = 1 .. 10)]), im...](images/SIR_146.gif)
![display([dirfield(F, 100, 22, 100), seq(phasedia(F, P0, 40), P0 = [seq(`<,>`(VectorCalculus:-`+`(100, VectorCalculus:-`-`(VectorCalculus:-`*`(2, k))), VectorCalculus:-`*`(2, k), 0), k = 1 .. 10)]), im...](images/SIR_147.gif) |
The maximal number of infected lies in the range 5-50 and there remain 18-58 susceptibles in the population after the epidemic.
| > |
![I[max] = seq(evalf[3](max(seq(P[2], P = orbit(F, P0, 40)))), P0 = [seq(`<,>`(VectorCalculus:-`+`(100, VectorCalculus:-`-`(VectorCalculus:-`*`(5, k))), VectorCalculus:-`*`(5, k), 0), k = 1 .. 10)]); 1](images/SIR_149.gif)
![I[max] = seq(evalf[3](max(seq(P[2], P = orbit(F, P0, 40)))), P0 = [seq(`<,>`(VectorCalculus:-`+`(100, VectorCalculus:-`-`(VectorCalculus:-`*`(5, k))), VectorCalculus:-`*`(5, k), 0), k = 1 .. 10)]); 1](images/SIR_150.gif) |
![I[max] = (5.86, 10.4, 15., 20., 25., 30., 35., 40., 45., 50.)](images/SIR_151.gif) |
(21) |
| > |
![S[infinity] = seq(evalf[3](iterate(F, P0, 40)[1]), P0 = [seq(`<,>`(VectorCalculus:-`+`(100, VectorCalculus:-`-`(VectorCalculus:-`*`(5, k))), VectorCalculus:-`*`(5, k), 0), k = 1 .. 10)]); 1](images/SIR_152.gif) |
![S[infinity] = (58.0, 48.3, 41.9, 37.4, 33.3, 29.3, 26.0, 23.3, 20.5, 18.0)](images/SIR_153.gif) |
(22) |
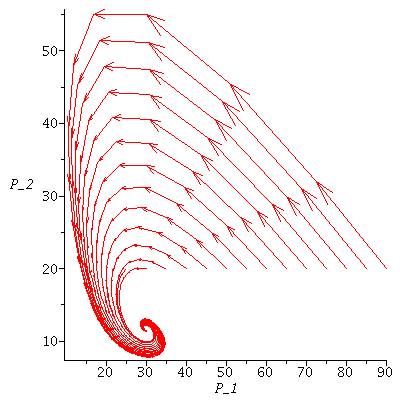
SIR endemic
| > |
 `(`+`(`*`(`+`(1, `-`(mu)), `*`(P[1])), `*`(mu, `*`(N)), `-`(`*`(alph..." align="center" border="0"> `(`+`(`*`(`+`(1, `-`(mu)), `*`(P[1])), `*`(mu, `*`(N)), `-`(`*`(alph..." align="center" border="0">
 `(`+`(`*`(`+`(1, `-`(mu)), `*`(P[1])), `*`(mu, `*`(N)), `-`(`*`(alph..." align="center" border="0"> `(`+`(`*`(`+`(1, `-`(mu)), `*`(P[1])), `*`(mu, `*`(N)), `-`(`*`(alph..." align="center" border="0">
 `(`+`(`*`(`+`(1, `-`(mu)), `*`(P[1])), `*`(mu, `*`(N)), `-`(`*`(alph..." align="center" border="0"> `(`+`(`*`(`+`(1, `-`(mu)), `*`(P[1])), `*`(mu, `*`(N)), `-`(`*`(alph..." align="center" border="0">
 `(`+`(`*`(`+`(1, `-`(mu)), `*`(P[1])), `*`(mu, `*`(N)), `-`(`*`(alph..." align="center" border="0"> `(`+`(`*`(`+`(1, `-`(mu)), `*`(P[1])), `*`(mu, `*`(N)), `-`(`*`(alph..." align="center" border="0">
 `(`+`(`*`(`+`(1, `-`(mu)), `*`(P[1])), `*`(mu, `*`(N)), `-`(`*`(alph..." align="center" border="0"> `(`+`(`*`(`+`(1, `-`(mu)), `*`(P[1])), `*`(mu, `*`(N)), `-`(`*`(alph..." align="center" border="0">
 `(`+`(`*`(`+`(1, `-`(mu)), `*`(P[1])), `*`(mu, `*`(N)), `-`(`*`(alph..." align="center" border="0"> `(`+`(`*`(`+`(1, `-`(mu)), `*`(P[1])), `*`(mu, `*`(N)), `-`(`*`(alph..." align="center" border="0">
 `(`+`(`*`(`+`(1, `-`(mu)), `*`(P[1])), `*`(mu, `*`(N)), `-`(`*`(alph..." align="center" border="0"> `(`+`(`*`(`+`(1, `-`(mu)), `*`(P[1])), `*`(mu, `*`(N)), `-`(`*`(alph..." align="center" border="0">
 `(`+`(`*`(`+`(1, `-`(mu)), `*`(P[1])), `*`(mu, `*`(N)), `-`(`*`(alph..." align="center" border="0"> `(`+`(`*`(`+`(1, `-`(mu)), `*`(P[1])), `*`(mu, `*`(N)), `-`(`*`(alph..." align="center" border="0">
 `(`+`(`*`(`+`(1, `-`(mu)), `*`(P[1])), `*`(mu, `*`(N)), `-`(`*`(alph..." align="center" border="0"> `(`+`(`*`(`+`(1, `-`(mu)), `*`(P[1])), `*`(mu, `*`(N)), `-`(`*`(alph..." align="center" border="0">
 `(`+`(`*`(`+`(1, `-`(mu)), `*`(P[1])), `*`(mu, `*`(N)), `-`(`*`(alph..." align="center" border="0"> `(`+`(`*`(`+`(1, `-`(mu)), `*`(P[1])), `*`(mu, `*`(N)), `-`(`*`(alph..." align="center" border="0">
 `(`+`(`*`(`+`(1, `-`(mu)), `*`(P[1])), `*`(mu, `*`(N)), `-`(`*`(alph..." align="center" border="0"> `(`+`(`*`(`+`(1, `-`(mu)), `*`(P[1])), `*`(mu, `*`(N)), `-`(`*`(alph..." align="center" border="0"> |
General theory
| > |
 |
| > |
![equi2(proc (P) options operator, arrow; `<,>`(F(P)[1], F(P)[2]) end proc); 1](images/SIR_183.gif) |
| > |
 |
 |
(25) |
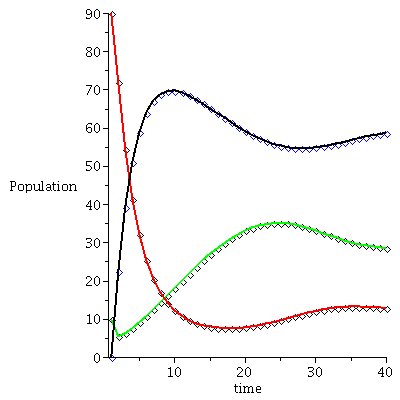
Example 1
| > |
 |
| > |
![equi2(proc (P) options operator, arrow; `<,>`(F(P)[1], F(P)[2]) end proc); 1](images/SIR_204.gif) |
| > |
![display([timeplot(F, `<,>`(95, 5, 0), 40), plot(rhoend(F), 0 .. 40, color = magenta)]); 1](images/SIR_211.gif) |
| > |
 |
| > |
![equi2(proc (P) options operator, arrow; `<,>`(F(P)[1], F(P)[2]) end proc); 1](images/SIR_215.gif) |
| > |
 |
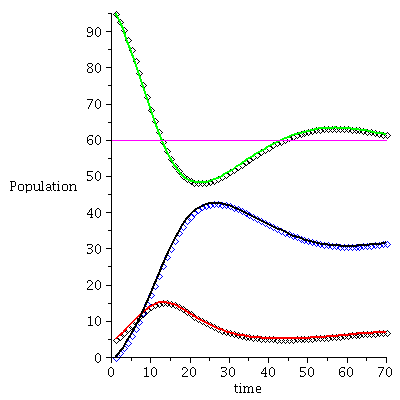
Example 2
| > |
 |
| > |
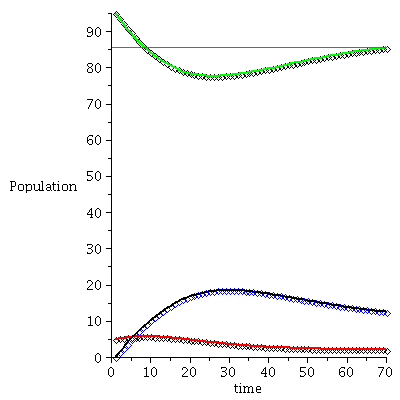
![display([timeplot(F, `<,>`(95, 5, 0), 70), plot(rhoend(F), 0 .. 70, color = magenta)]); 1](images/SIR_228.gif) |
| > |
 |
| > |
![equi2(proc (P) options operator, arrow; `<,>`(F(P)[1], F(P)[2]) end proc); 1](images/SIR_232.gif) |
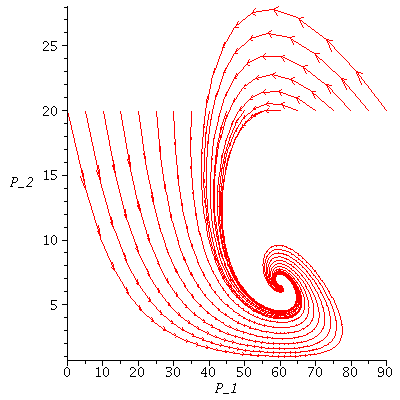
Example 3
| > |
 |
| > |
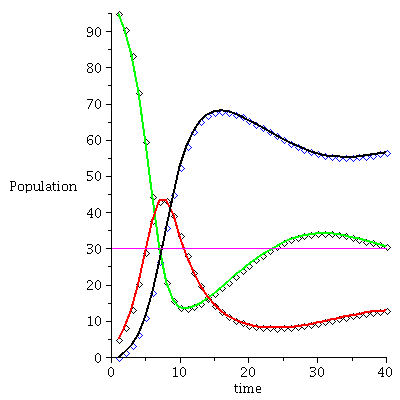
![display([timeplot(F, `<,>`(95, 5, 0), 70), plot(rhoend(F), 0 .. 70, color = magenta)]); 1](images/SIR_243.gif) |
| > |
 |
| > |
![equi2(proc (P) options operator, arrow; `<,>`(F(P)[1], F(P)[2]) end proc); 1](images/SIR_247.gif) |
