Matrix models
If you click on !!! (the menu bar at the top) maple will execute all commands.
You can also enter each command as you go along reading this document. You may enter your own commands at any time and place in this document.
| > |
 |
# this can not be made into a procedure of a list because of a bug in Maple; see bug.mw
#temppopP(P,u,T) = tempplot([orbitP(P,u,T)])
#temppopF(P,u,T) = tempplot([orbitF(F,u,T)])
We consider the matrix model from Allman and Rhodes, Mathematical models in biology, p 42, for an insect population.
| > |
![`assign`(P[insect], Matrix(3, 3, [0, 0, 73, 0.4e-1, 0, 0, 0, .39, .65])); 1](images/matrix_models_129.gif) |
 |
(1) |
The 20-generation population orbit through u0=<0,0,5> is
| > |
![`assign`(S, orbitP(P[insect], `<,>`(0, 0, 5), 20)); -1](images/matrix_models_131.gif) |
| > |
![seq(`<,>`(seq(floor(S[j][i]), i = 1 .. 3)), j = 1 .. 20); 1](images/matrix_models_132.gif) |
, Vector[column](%id = 136119272), Vector[column](%id = 136119128), Vector[column](%id = 136118824), Vector[column](%id = 136117224), Vector[column](%id = 136100484), Ve...](images/matrix_models_133.gif)
, Vector[column](%id = 136119272), Vector[column](%id = 136119128), Vector[column](%id = 136118824), Vector[column](%id = 136117224), Vector[column](%id = 136100484), Ve...](images/matrix_models_134.gif) |
(2) |
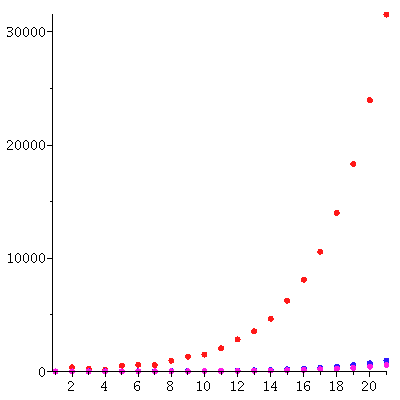
The temporal graph of the population vectors is
| > |
![tempplot([S]); 1](images/matrix_models_135.gif) |

| > |
![orbitF(proc (u) options operator, arrow; N(P[insect], u) end proc, nrm(`<,>`(0, 0, 5)), 20); -1](images/matrix_models_138.gif) |
| > |
![`assign`(PD[insect], seq(`<,>`(seq(floor(%[j][i]), i = 1 .. 3)), j = 1 .. 20)); 1](images/matrix_models_139.gif) |
, Vector[column](%id = 141989028), Vector[column](%id = 141989092), Vector[column](%id = 141989156), Vector[column](%id = 141989220), Vector[column](%id = 141989284), Ve...](images/matrix_models_140.gif)
, Vector[column](%id = 141989028), Vector[column](%id = 141989092), Vector[column](%id = 141989156), Vector[column](%id = 141989220), Vector[column](%id = 141989284), Ve...](images/matrix_models_141.gif) |
(3) |
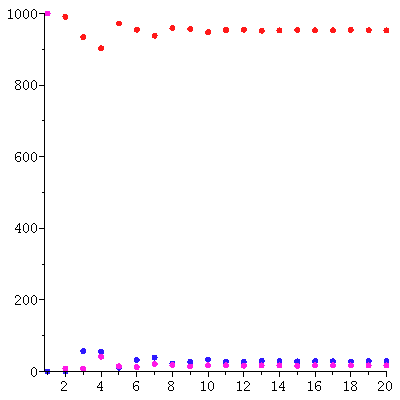
stabilizes.
Here is a graph of the population distribution
| > |
![tempplot([PD[insect]]); 1](images/matrix_models_142.gif) |
The stable population distribution is
| > |
![`assign`(y[infinity], PD[insect][20]); 1](images/matrix_models_144.gif) |
](images/matrix_models_145.gif) |
(4) |
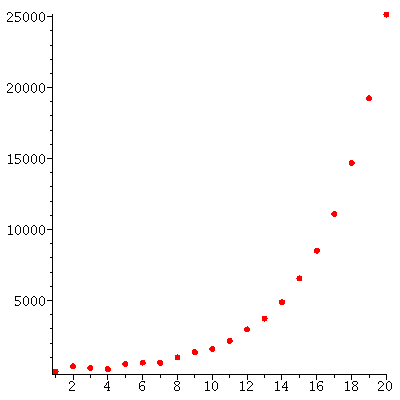
The total population through the 20 generations
| > |
![pointplot({seq([j, add(S[j][i], i = 1 .. 3)], j = 1 .. 20)}, color = red, symbol = solidcircle, symbolsize = 15, connect = false); 1](images/matrix_models_146.gif)
![pointplot({seq([j, add(S[j][i], i = 1 .. 3)], j = 1 .. 20)}, color = red, symbol = solidcircle, symbolsize = 15, connect = false); 1](images/matrix_models_147.gif) |
grows (approximately) exponentially: The total populations size is c* λ_∞^t for some constant c and some stable growth rate λ_∞.
Conclusion
1.The population distribution stabilizes at the stable population distribution
2. The total population grows exponentially with a stable growth rate
Let us now try to determine the stable growth rate λ_∞.
Since y_∞ is a stable distribution, we expect Py_∞ to have the same population distribution. This means that we expect Py_∞ to be proportional to y_∞. The proportionality factor must be the stable growth rate λ_∞.
We therefore estimate the stable growth rate to be
| > |
![`assign`(lambda[infinity], `/`(`*`(add(Typesetting:-delayDotProduct(P[insect], y[infinity])[i], i = 1 .. 3)), `*`(add(y[infinity][i], i = 1 .. 3)))); 1](images/matrix_models_149.gif) |
 |
(5) |
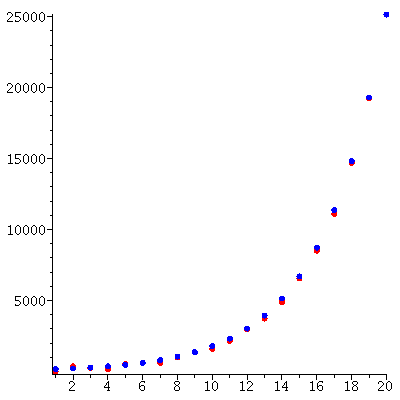
We choose the constant c so that the two graphs agree at t=20, so that total population size at t=20 is c* λ_∞^(20).
| > |
![`assign`(c, `/`(`*`(add(S[20][i], i = 1 .. 3)), `*`(`^`(lambda[infinity], 20)))); 1](images/matrix_models_151.gif) |
 |
(6) |
Here is the predicted exponential growth of the total population compared to the actual total population
We see a good match between the two curves.
Based on this, we predict that the population vector is approximately c/add(y_∞[i],i=1..3)*λ_∞^t*y_∞.
We compare this prediction to the actual population vector
| > |
![`assign`(Sd, seq(`+`(`*`(`/`(1, 1000), `*`(c, `*`(`^`(lambda[infinity], t), `*`(y[infinity])))), `-`(S[t])), t = 1 .. 20)); -1](images/matrix_models_157.gif) |
| > |
![seq(`<,>`(seq(floor(Sd[t][i]), i = 1 .. 3)), t = 1 .. 20); 1](images/matrix_models_158.gif) |
, Vector[column](%id = 139324236), Vector[column](%id = 139324300), Vector[column](%id = 139324364), Vector[column](%id = 139324428), Vector[column](%id = 139324492), Ve...](images/matrix_models_159.gif)
, Vector[column](%id = 139324236), Vector[column](%id = 139324300), Vector[column](%id = 139324364), Vector[column](%id = 139324428), Vector[column](%id = 139324492), Ve...](images/matrix_models_160.gif) |
(7) |
The Fundamental Theorem of Demography says that the stable growth rate is the dominating eigenvalue and the stable distribution is its eigenvector.
We check that the stable growth rate is the dominating eigenvalue.
The eigenvalues are
| > |
![`assign`(eigenvals, Eigenvalues(P[insect])); 1](images/matrix_models_161.gif) |
](images/matrix_models_162.gif) |
(8) |
so the dominating eigenvalue is
| > |
 |
 |
(9) |
The dominating eigenvalue, 1.3117, is indeed close to λ_∞.
We also check if the stable distribution is an eigenvector
| > |
![`+`(Typesetting:-delayDotProduct(P[insect], y[infinity]), `-`(`*`(lambda[infinity], `*`(y[infinity])))); 1](images/matrix_models_165.gif) |
](images/matrix_models_166.gif) |
(10) |
Yes, 
As a second example we consider the matrix model from Allman and Rhodes, Mathematical models in biology, p 56, for a plant population.
The projection matrix for this model is
| > |
![`assign`(P[plant], Matrix(4, 4, [0.2e-1, 0, 11.9, 0, 0.5e-1, .12, 5.7, 0, 0, .14, .21, .32, 0, 0, .43, .11])); 1](images/matrix_models_168.gif) |
 |
(11) |
The 20-generation population orbit through u0=<0,50,50,0> is
| > |
![`assign`(S, orbitP(P[plant], `<,>`(0, 50, 50, 0), 20)); -1](images/matrix_models_170.gif) |
| > |
![seq(`<,>`(seq(floor(S[j][i]), i = 1 .. 4)), j = 1 .. 20); 1](images/matrix_models_171.gif) |
, Vector[column](%id = 139120152), Vector[column](%id = 139120216), Vector[column](%id = 139120280), Vector[column](%id = 139120344), Vector[column](%id = 139120408), Ve...](images/matrix_models_172.gif)
, Vector[column](%id = 139120152), Vector[column](%id = 139120216), Vector[column](%id = 139120280), Vector[column](%id = 139120344), Vector[column](%id = 139120408), Ve...](images/matrix_models_173.gif) |
(12) |
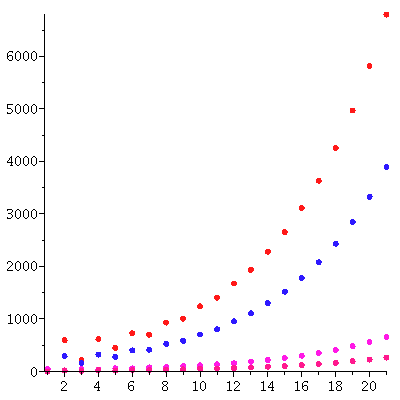
The temporal graph of the population vecors
| > |
![tempplot([S]); 1](images/matrix_models_174.gif) |

| > |
![orbitF(proc (u) options operator, arrow; N(P[plant], u) end proc, nrm(`<,>`(0, 50, 50, 0)), 20); -1](images/matrix_models_177.gif) |
| > |
![`assign`(PD[plant], seq(`<,>`(seq(floor(%[j][i]), i = 1 .. 4)), j = 1 .. 20)); 1](images/matrix_models_178.gif) |
, Vector[column](%id = 152877668), Vector[column](%id = 152877732), Vector[column](%id = 152877796), Vector[column](%id = 152877860), Vector[column](%id = 152877924), Ve...](images/matrix_models_179.gif)
, Vector[column](%id = 152877668), Vector[column](%id = 152877732), Vector[column](%id = 152877796), Vector[column](%id = 152877860), Vector[column](%id = 152877924), Ve...](images/matrix_models_180.gif) |
(13) |
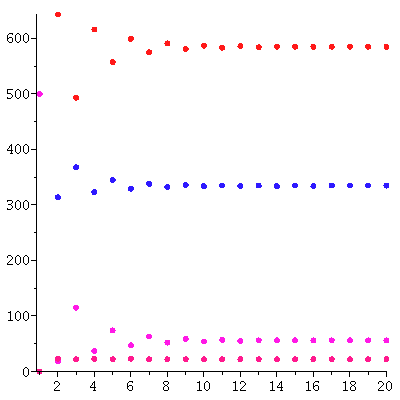
stabilizes.
Here is a graph of the population distribution
| > |
![tempplot([PD[plant]]); 1](images/matrix_models_181.gif) |
The stable population distribution is
| > |
![`assign`(y[infinity], PD[plant][20]); 1](images/matrix_models_183.gif) |
](images/matrix_models_184.gif) |
(14) |
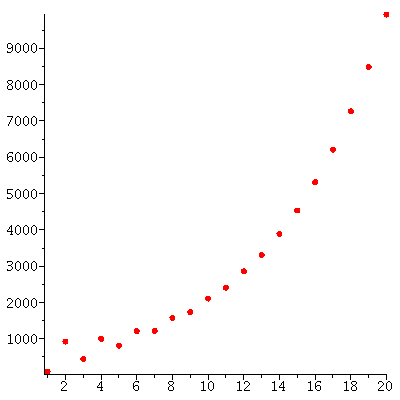
The total population through the 20 generations
| > |
![pointplot({seq([j, add(S[j][i], i = 1 .. 4)], j = 1 .. 20)}, color = red, symbol = solidcircle, symbolsize = 15, connect = false); 1](images/matrix_models_185.gif)
![pointplot({seq([j, add(S[j][i], i = 1 .. 4)], j = 1 .. 20)}, color = red, symbol = solidcircle, symbolsize = 15, connect = false); 1](images/matrix_models_186.gif) |
grows (approximately) exponentially: The total populations size is c* λ_∞^t for some constant c and some stable growth rate λ_∞.
Conclusion
1.The population distribution stabilizes at the stable population distribution
2. The total population grows exponentially with a stable growth rate
Let us now try to determine the stable growth rate λ_∞.
Since there is a stable population distribution y_∞, we expect Py_∞ to have the same population distribution. This means that we expect Py_∞ to be proportional to y_∞. The proportionality factor must be the stable growth rate λ_∞.
We therefore estimate the stable growth rate to be
| > |
![`assign`(lambda[infinity], `/`(`*`(add(Typesetting:-delayDotProduct(P[plant], y[infinity])[i], i = 1 .. 4)), `*`(add(y[infinity][i], i = 1 .. 4)))); 1](images/matrix_models_188.gif) |
 |
(15) |
We choose the constant c so that the two graphs agree at t=20, so that total population size at t=20 is c* λ_∞^(20).
| > |
![`assign`(c, `/`(`*`(add(S[20][i], i = 1 .. 4)), `*`(`^`(lambda[infinity], 20)))); 1](images/matrix_models_190.gif) |
 |
(16) |
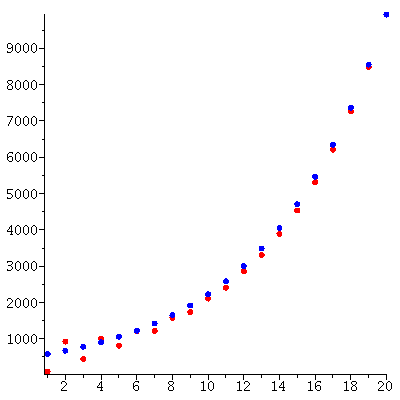
Here is the predicted exponential growth of the total population compared to the actual total population
We see a good match between the two curves.
Based on this, we predict that the population vector is approximately c/add(y_∞[i],i=1..4)*λ_∞^t*y_∞.
We compare this predicted population vector and the actual population vector
| > |
![`assign`(Sd, seq(`+`(`*`(`/`(1, 1000), `*`(c, `*`(`^`(lambda[infinity], t), `*`(y[infinity])))), `-`(S[t])), t = 1 .. 20)); -1](images/matrix_models_196.gif) |
| > |
![seq(`<,>`(seq(floor(Sd[t][i]), i = 1 .. 3)), t = 1 .. 20); 1](images/matrix_models_197.gif) |
, Vector[column](%id = 136962668), Vector[column](%id = 136854192), Vector[column](%id = 136818788), Vector[column](%id = 135571688), Vector[column](%id = 135571496), Ve...](images/matrix_models_198.gif)
, Vector[column](%id = 136962668), Vector[column](%id = 136854192), Vector[column](%id = 136818788), Vector[column](%id = 135571688), Vector[column](%id = 135571496), Ve...](images/matrix_models_199.gif) |
(17) |
The Fundamental Theorem of Demography says that the stable growth rate is the dominating eigenvalue and the stable distribution is its eigenvector.
We check that the stable growth rate is the dominating eigenvalue.
The eigenvalues are
| > |
![`assign`(eigenvals, Eigenvalues(P[plant])); 1](images/matrix_models_200.gif) |
](images/matrix_models_201.gif) |
(18) |
so the dominating eigenvalue is
| > |
 |
 |
(19) |
The dominating eigenvalue, 1.3117, is indeed close to
| > |
![lambda[infinity]; 1](images/matrix_models_204.gif) |
 |
(20) |
We also check if the stable distribution is an eigenvector
| > |
![`+`(Typesetting:-delayDotProduct(P[plant], y[infinity]), `-`(`*`(lambda[infinity], `*`(y[infinity])))); 1](images/matrix_models_206.gif) |
](images/matrix_models_207.gif) |
(21) |
Yes, 
These two examples corroborate the Fundamental Theorem of Demography.
Here is a little program, dom, that runs the same computations as above and gives an estimate for the stable distribution and the stable growth rate. I apply it to the above two examples and to the coyote model from Allman and Rhodes, Mathematical models in biology, p 63
| > |
![dom(P[insect]); 1](images/matrix_models_209.gif) |
| > |
![dom(P[plant]); 1](images/matrix_models_216.gif) |
| > |
![`assign`(P[coyote], `<|>`(`<,>`(.11, .3, 0), `<,>`(.15, 0, .6), `<,>`(.15, 0, .6))); 1](images/matrix_models_223.gif) |
 |
(24) |
| > |
![dom(P[coyote]); 1](images/matrix_models_225.gif) |

, Vector[column](%id = 136119272), Vector[column](%id = 136119128), Vector[column](%id = 136118824), Vector[column](%id = 136117224), Vector[column](%id = 136100484), Ve...](images/matrix_models_133.gif)
, Vector[column](%id = 136119272), Vector[column](%id = 136119128), Vector[column](%id = 136118824), Vector[column](%id = 136117224), Vector[column](%id = 136100484), Ve...](images/matrix_models_134.gif)
![]()
, Vector[column](%id = 141989028), Vector[column](%id = 141989092), Vector[column](%id = 141989156), Vector[column](%id = 141989220), Vector[column](%id = 141989284), Ve...](images/matrix_models_140.gif)
, Vector[column](%id = 141989028), Vector[column](%id = 141989092), Vector[column](%id = 141989156), Vector[column](%id = 141989220), Vector[column](%id = 141989284), Ve...](images/matrix_models_141.gif)
](images/matrix_models_145.gif)
, Vector[column](%id = 139324236), Vector[column](%id = 139324300), Vector[column](%id = 139324364), Vector[column](%id = 139324428), Vector[column](%id = 139324492), Ve...](images/matrix_models_159.gif)
, Vector[column](%id = 139324236), Vector[column](%id = 139324300), Vector[column](%id = 139324364), Vector[column](%id = 139324428), Vector[column](%id = 139324492), Ve...](images/matrix_models_160.gif)
](images/matrix_models_162.gif)
](images/matrix_models_166.gif)
![]()

, Vector[column](%id = 139120152), Vector[column](%id = 139120216), Vector[column](%id = 139120280), Vector[column](%id = 139120344), Vector[column](%id = 139120408), Ve...](images/matrix_models_172.gif)
, Vector[column](%id = 139120152), Vector[column](%id = 139120216), Vector[column](%id = 139120280), Vector[column](%id = 139120344), Vector[column](%id = 139120408), Ve...](images/matrix_models_173.gif)
![]()
, Vector[column](%id = 152877668), Vector[column](%id = 152877732), Vector[column](%id = 152877796), Vector[column](%id = 152877860), Vector[column](%id = 152877924), Ve...](images/matrix_models_179.gif)
, Vector[column](%id = 152877668), Vector[column](%id = 152877732), Vector[column](%id = 152877796), Vector[column](%id = 152877860), Vector[column](%id = 152877924), Ve...](images/matrix_models_180.gif)
](images/matrix_models_184.gif)
, Vector[column](%id = 136962668), Vector[column](%id = 136854192), Vector[column](%id = 136818788), Vector[column](%id = 135571688), Vector[column](%id = 135571496), Ve...](images/matrix_models_198.gif)
, Vector[column](%id = 136962668), Vector[column](%id = 136854192), Vector[column](%id = 136818788), Vector[column](%id = 135571688), Vector[column](%id = 135571496), Ve...](images/matrix_models_199.gif)
](images/matrix_models_201.gif)
](images/matrix_models_207.gif)
![]()


